

0 引言
【研究意义】土壤不仅是孕育食物的重要物质基础,而且对环境质量、动植物健康有重要影响[1
1 材料与方法
1.1 材料
1.1.1 试验区概况
试验于新疆阿克苏地区库车市,阿克苏地区为典型暖温带大陆性干旱气候特征,降水少、降水量年季变化大,年降水量53.2~120.6 mm;年日照时数2 670~3 022 h,太阳的总辐射量为5 340~6 220 MJ/m2,光照充足,光热资源较丰富,气温年较差及昼夜温差大,无霜期长,全年为168~225 d,年平均气温7.9~13.7℃。表1
表1 土壤和供试材料基本理化性质
Tab.1
| 供试土壤 Soil for test (cm) | 有机质 Organic matter (g/kg) | 土壤含水率 Soil moisture content (%) | 土壤容重 Soil bulk density (g/cm3) | 水解性氮 Hydrolyzed nitrogen (mg/kg) | 有效磷 Available phosphorus (mg/kg) | 速效钾 Rapidly available potassium (mg/kg) | 水溶性盐分 Water-soluble salt (g/kg) |
|---|---|---|---|---|---|---|---|
| 0~15 | 11.3 | 0.16 | 1.50 | 105.2 | 16.4 | 235 | 11.4 |
| 15~30 | 11.7 | 0.14 | 1.55 | 86.7 | 21.1 | 226 | 13.2 |
1.1.2 肥料
供试材料分别为N:农家肥(腐熟牛粪),有机质含量为77.2%;T:生物炭,有机质含量为62%和25%腐植酸;J:生物菌肥,有机质含量为60%和2%海藻提取物;S:商品有机肥,有机质含量为50%;H:黄腐酸钾:有机质含量为70%和少量腐植酸。
1.2 方法
1.2.1 试验设计
试验地选择在阿克苏地区库车市墩阔坦镇,小区试验设计5个处理1个对照,每个处理分别为推荐量-50%(1)、推荐量(2)、推荐量+50%(3)3个梯度,每个试验小区规格为10 m×9 m,面积为90 m2,总共16个小区。
1.2.2 测定指标
1.2.2.1 土壤团聚体组成
于2023年5月20日(棉花苗期)在每个处理取0~30 cm土壤样品,每15 cm为1层,每个处理各层次均取3次重复。土壤团聚体采用湿筛法进行测定,将样品放置于孔径自上而下为2、1、0.5、0.25和0.1 mm的各级套筛之上,振荡筛分 5 min(30 次/min),最后将各级筛层团聚体洗入铝盒中,烘干称重,根据公式(1)计算所得各粒径团聚体质量百分比[22]。
式中,Ai为某粒级团聚体的质量百分数(%);Gi为该粒级团聚体的烘干质量(g);MT为团聚体总质量(g)。
1.2.2.2 土壤容重和孔隙度
于2023年5月20日(棉花苗期)在每个处理取0~30 cm土壤容重样品,每15 cm为1层,每个处理各层次均取3次重复,取样时间与团聚体取样时间相同。根据式(2)计算容重[23],式(3)为土壤总孔隙度的计算方法。
式中,pd 为某层土壤的容重(g/cm3);M 为质量(g);V 为单位体积(cm3)。
式中,土壤比重近似2.65 g/cm3。
1.2.2.3 棉花植株株高、茎粗以及干鲜重
于2023年5月20日棉花苗期时从每个处理中按照五点法每个点取3株棉花植株,然后将各部分样品带回室内,测量称取植株的株高和茎粗以及地上部和地下部的鲜重,于105℃杀青30 min后,70℃烘干至恒重,称量地上部和地下部的干重。
2 结果与分析
2.1 黏质土壤改良对土壤物理性质的影响
2.1.1 不同碳源物质输入对土壤容重的影响
研究表明,随着不同碳源物质的输入,各处理0~30 cm土壤容重均有显著降低趋势。农家肥、生物炭、生物菌肥、商品有机肥以及黄腐酸对于土壤结构改良有明显作用,且不同碳源物质对土壤结构改良效果不同。不同碳源物质以及不同梯度之间存在着差异性,其中N组和T组中的N2和T2处理对容重改良效果比较明显,而随着施用量的增加,N3和T3处理的容重反而增加,呈负相关关系。J组、S组以及H组的容重随着施用量的增加而降低,3种碳源物质对容重的改良效果与添加量呈正相关关系。生物炭对于土壤容重改良效果最佳,其中T2处理改良效果最佳,与CK处理相比,T2处理中0~15 cm容重降低了12.78%;15~30 cm容重降低了10.71%。其次为黄腐酸,黄腐酸中H3处理对土壤改良效果较佳,较之CK分别降低了11.11%和13.97%。生物菌肥和农家肥对于土壤容重改良效果相对较低,其中J3处理和N2处理改良效果相比与J1、J2、N1及N3处理较优,J3处理容重分别降低了9.49%和14.07%,N2处理容重分别降低了12.78%和10.71%,对土壤容重改良效果由优到差依次表现为T组>H组>S组>N组>J组。图1,表2~3
图1
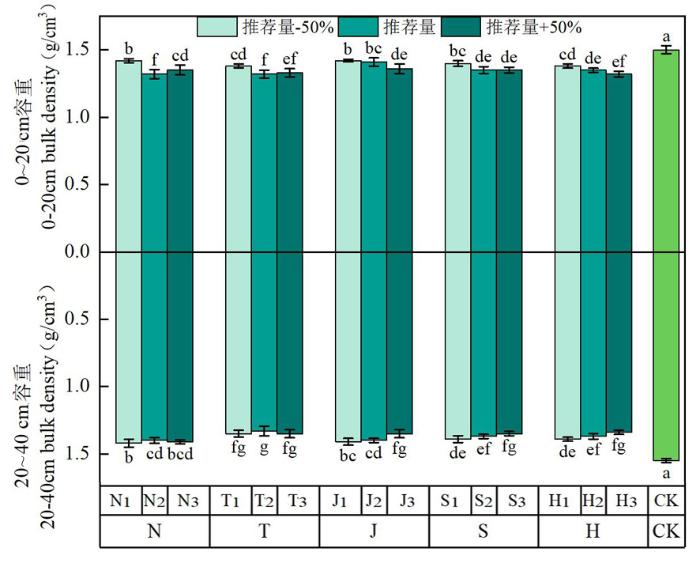
图1
不同碳源物质下土壤容重的变化
注:不同小写字母表示差异显著(P<0.05),下同
Fig.1
Changes of different carbon source substances on soil bulk density
Notes:Different lowerease letters represent signifficant differdnces (P<0.05),the same as below
表2 0~30 cm土壤容重试验结果方差
Tab.2
| 项目 Items | 变异来源 Source of variation | 平方和 Sum of squares | 自由度df Degree of freedom df | 均方 Mean square | 比值F Ratio F | 显著性 Significance | |
|---|---|---|---|---|---|---|---|
| 0~15 cm容重 0-15cm Bulk density | N组 | 组间 | 0.016 | 2 | 0.008 | 12.633 | P <0.01 |
| 组内 | 0.004 | 6 | 0.001 | ||||
| 总数 | 0.020 | 8 | |||||
| T组 | 组间 | 0.006 | 2 | 0.003 | 10.513 | P <0.01 | |
| 组内 | 0.002 | 6 | 0.000 | ||||
| 总数 | 0.008 | 8 | |||||
| J组 | 组间 | 0.006 | 2 | 0.003 | 20.523 | P <0.01 | |
| 组内 | 0.001 | 6 | 0.000 | ||||
| 总数 | 0.007 | 8 | |||||
| S组 | 组间 | 0.005 | 2 | 0.002 | 21.563 | P <0.01 | |
| 组内 | 0.001 | 6 | 0.000 | ||||
| 总数 | 0.006 | 8 | |||||
| H组 | 组间 | 0.005 | 2 | 0.003 | 14.119 | P <0.01 | |
| 组内 | 0.002 | 6 | 0.000 | ||||
| 总数 | 0.007 | 8 | |||||
| 15~30 cm容重 15-30 cm Bulk density | N组 | 组间 | 0.001 | 2 | 0.001 | 10.102 | P <0.05 |
| 组内 | 0.000 | 6 | 0.000 | ||||
| 总数 | 0.001 | 8 | |||||
| T组 | 组间 | 0.001 | 2 | 0.001 | 5.180 | P <0.05 | |
| 组内 | 0.000 | 6 | 0.000 | ||||
| 总数 | 0.001 | 8 | |||||
| J组 | 组间 | 0.006 | 2 | 0.003 | 32.037 | P <0.01 | |
| 组内 | 0.001 | 6 | 0.000 | ||||
| 总数 | 0.007 | 8 | |||||
| S组 | 组间 | 0.002 | 2 | 0.001 | 6.947 | P <0.05 | |
| 组内 | 0.001 | 6 | 0.000 | ||||
| 总数 | 0.003 | 8 | |||||
| H组 | 组间 | 0.004 | 2 | 0.002 | 11.361 | P <0.01 | |
| 组内 | 0.001 | 6 | 0.000 | ||||
| 总数 | 0.005 | 8 | |||||
表3 0~30 cm土壤孔隙度试验结果方差
Tab.3
| 项目 Items | 变异来源 Source of variation | 平方和 Sum of squares | 自由度df Degree of freedom df | 均方 Mean square | 比值F Ratio F | 显著性 Significance | |
|---|---|---|---|---|---|---|---|
| 0~15 cm孔隙度 0-15 cm Porosity | N组 | 组间 | 19.300 | 2 | 9.650 | 2.906 | P =0.131 |
| 组内 | 19.925 | 6 | 3.321 | ||||
| 总数 | 39.255 | 8 | |||||
| T组 | 组间 | 7.491 | 2 | 3.745 | 1.372 | P =0.323 | |
| 组内 | 16.374 | 6 | 2.729 | ||||
| 总数 | 23.864 | 8 | |||||
| J组 | 组间 | 4.353 | 2 | 2.176 | 0.826 | P =0.482 | |
| 组内 | 15.817 | 6 | 2.636 | ||||
| 总数 | 20.169 | 8 | |||||
| S组 | 组间 | 2.286 | 2 | 1.143 | 0.481 | P =0.640 | |
| 组内 | 14.262 | 6 | 2.377 | ||||
| 总数 | 16.548 | 8 | |||||
| H组 | 组间 | 0.645 | 2 | 0.322 | 0.173 | P =0.845 | |
| 组内 | 11.207 | 6 | 1.868 | ||||
| 总数 | 11.852 | 8 | |||||
| 15~30 cm孔隙度 15-30 cm Porosity | N组 | 组间 | 3.538 | 2 | 1.769 | 0.340 | P =0.725 |
| 组内 | 31.218 | 6 | 5.203 | ||||
| 总数 | 34.756 | 8 | |||||
| T组 | 组间 | 9.830 | 2 | 4.915 | 1.686 | P =0.262 | |
| 组内 | 17.495 | 6 | 2.916 | ||||
| 总数 | 27.325 | 8 | |||||
| J组 | 组间 | 28.111 | 2 | 14.056 | 3.713 | P =0.089 | |
| 组内 | 22.714 | 6 | 3.786 | ||||
| 总数 | 50.825 | 8 | |||||
| S组 | 组间 | 21.268 | 2 | 10.634 | 5.353 | P <0.05 | |
| 组内 | 11.919 | 6 | 1.987 | ||||
| 总数 | 33.187 | 8 | |||||
| H组 | 组间 | 32.959 | 2 | 16.479 | 7.252 | P <0.05 | |
| 组内 | 13.634 | 6 | 2.272 | ||||
| 总数 | 46.593 | 8 | |||||
2.1.2 不同碳源物质输入对土壤孔隙度的影响
研究表明,施入不同碳源物质对0~30 cm土壤的孔隙度均有显著性影响,且各组之间均表现出差异性。在0~15 cm土壤中,N组和T组中的N2和T2处理对土壤孔隙度改良效果最佳,相较于CK处理,孔隙度分别增大了14.97%和15.22%。J组、S组以及H组中随着碳源物质输入量的增加,土壤孔隙度也依次增大,3种碳源物质对土壤孔隙度的改良呈正相关关系。其中J3、S3和H3处理相比较于CK分别增加了11.87%、13.86%和13.88%。
图2
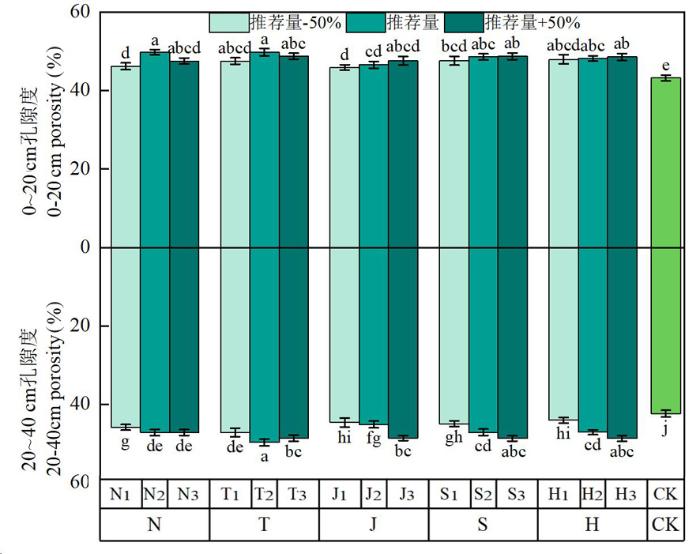
图2
不同碳源物质下土壤孔隙度的变化
Fig.2
Changes of different carbon source materials on soil porosity
表4 不同碳源物质下土壤团聚体的变化
Tab.4
| 土层 Soil layer 0~15 cm | 处理 Treatments | 粒径Particle size(mm) | ||||
|---|---|---|---|---|---|---|
| >2 | 1~2 | 0.5~1 | 0.25~0.5 | 0.1~0.25 | ||
| N1 | 2.043 3i | 0.603 3i | 6.160 0f | 26.286 7p | 20.440 7h | |
| N | N2 | 3.726 7d | 0.860 0h | 10.453 3b | 30.720 0k | 21.435 6e |
| N3 | 4.950 0b | 1.750 0b | 11.753 3a | 36.760 0h | 24.676 7c | |
| T1 | 3.663 3de | 0.500 0k | 6.134 2f | 28.126 7n | 19.916 7i | |
| T | T2 | 8.446 7a | 3.483 3a | 11.658 9ab | 28.656 7m | 20.513 4g |
| T3 | 3.660 0de | 1.193 3d | 6.185 4e | 35.433 3i | 25.043 5b | |
| J1 | 1.586 7k | 0.763 4h | 10.086 7c | 32.462 2j | 20.940 0f | |
| J | J2 | 1.746 7j | 0.503 3k | 5.953 4g | 44.406 7e | 21.560 7d |
| J3 | 2.483 3h | 1.100 0f | 4.843 6h | 50.430 0a | 26.460 0a | |
| S1 | 3.620 0g | 1.150 0e | 8.235 6d | 46.050 0d | 17.965 4m | |
| S | S2 | 3.813 3f | 1.060 0f | 2.636 7k | 46.340 0c | 18.160 0l |
| S3 | 4.070 0c | 1.330 0c | 2.760 0j | 48.320 0b | 18.936 6j | |
| H1 | 3.643 3l | 1.000 0g | 10.635 4b | 27.466 7o | 15.740 0o | |
| H | H2 | 3.246 7e | 1.750 0b | 8.030 0e | 37.652 4g | 16.306 7n |
| H3 | 4.943 3b | 1.790 0b | 2.466 7l | 42.135 6f | 20.436 7h | |
| CK | 1.520 0k | 0.576 7j | 3.823 3i | 30.462 7l | 18.673 3k | |
| N1 | 1.953 9l | 0.539 3m | 6.096 3h | 26.028 4k | 26.030 1e | |
| N | N2 | 3.561 8g | 0.810 6j | 10.405 3d | 30.224 2i | 27.093 0d |
| N3 | 4.840 6c | 1.706 4c | 11.700 5a | 34.815 8g | 29.475 7c | |
| T1 | 3.511 9h | 0.496 7n | 6.100 9h | 25.232 2l | 24.276 7g | |
| T | T2 | 8.207 2a | 3.404 5a | 11.598 9b | 27.535 7j | 25.403 9f |
| T3 | 3.423 5i | 1.153 0e | 6.107 4h | 33.648 6h | 30.361 0b | |
| J1 | 1.506 9n | 0.700 6k | 10.001 2e | 30.860 2i | 25.326 7f | |
| J | J2 | 1.706 9m | 0.499 5n | 5.902 3i | 40.728 3e | 26.428 6e |
| J3 | 2.479 7k | 1.053 8g | 4.805 7j | 45.795 0a | 31.297 9a | |
| S1 | 3.538 6g | 1.113 7f | 3.704 5l | 41.652 7d | 22.464 5i | |
| S | S2 | 3.791 8e | 0.993 9h | 2.704 5m | 42.632 9c | 23.549 6h |
| S3 | 3.999 8d | 1.303 4d | 8.199 1f | 44.225 8b | 24.766 5g | |
| H1 | 3.647 5f | 0.953 4i | 2.398 8n | 23.238 9n | 20.554 3k | |
| H | H2 | 3.112 8j | 1.702 7c | 7.990 0g | 32.942 9h | 21.734 0j |
| H3 | 4.900 9b | 1.752 5b | 10.601 0c | 37.231 5f | 25.959 9e | |
| CK | 1.493 8o | 0.552 4l | 3.527 3k | 24.551 4m | 23.719 5h | |
2.1.3 土壤水稳定大团聚体
研究表明,在0~15 cm土壤中,除了施入生物菌肥中的J1、T1和J2处理之外,其它各个处理相比较CK均显著增加了>2 mm和1~2 mm的土壤团聚体粒,其中N3、T2、J3、S3和H3处理在各组碳源物质中效果最显著,相比较于CK处理分别增加了225.66%、455.70%、63.38%、167.76%、225.22%和203.45%、504.01%、90.74%、130.62%、210.39%;而除了生物炭处理,其他碳源物质随着施用量的增加效果也逐渐明显,呈正相关关系;而施入的5种碳源物质中,N3、T2、J1、S1、H1处理则对0.5~1 mm土壤团聚体的改良效果最明显,相较于CK处理分别增加了207.41%、204.94%、163.82%、115.41%和178.17%;其中除了S2、S3以及H3处理之外,其他处理对1~2 mm土壤团聚体也有显著影响;在0.1~0.25 mm土壤团聚体改良中发现,随着碳源物质的施入量增加,改良效果也逐渐增加,呈正相关关系,在0.1~0.25 mm土壤团聚体改良中,除N2、J1和S1、S2、S3、H1和H2处理之外,其他处理相较于CK处理均有显著性差异,其中效果最明显的N3、T3、J3、S3和H3处理相比CK分别增加了20.67%、16.32%、65.55%、58.62%、38.32%、32.15%、34.11%、41.70%、1.55%和9.44%。
15~30 cm土壤中,N组中的N3处理显著增加了0.1~2 mm粒径土壤水稳性团聚体,N3处理中的>2 mm、1~2 mm、0.5~1 mm、0.25~0.5 mm、0.1~0.25 mm粒径水稳性团聚体相较于CK处理分别增加了224.05%、208.91%、231.71%、41.81%和24.27%;T组中的T2和T3处理显著增加了0.5~2 mm和0.1~0.5 mm粒径土壤水稳性团聚体,T2处理中的>2 mm、1~2 mm、0.5~1 mm和T3处理中的0.25~0.5 mm、0.1~0.25 mm粒径水稳性团聚体相较于CK处理分别增加了455.70%、516.31%、228.83%和37.05%、28%;J组中的J3处理和J1处理显著增加了各粒径土壤水稳性团聚体,J3处理中的>2 mm、1~2 mm、0.25~0.5 mm、0.1~0.25 mm和J1处理中的0.5~1 mm粒径水稳性团聚体相较于CK处理分别增加了66%、90.77%、86.53%、31.95%和183.54%;S和H组中的S3和H3显著增加了各粒径土壤水稳性团聚体,相较于CK处理分别增加了167.76%、135.95%、132.45%、80.14%、4.4%和144.18%、217.25%、200.54%、51.65%和9.4%。
表5 0~30 cm团聚体试验结果方差
Tab.5
| 项目 Items | 变异来源 Source of variation | 平方和 Sum of squares | 自由度df Degree of freedom df | 均方 mean square | 比值F Ratio F | 显著性 Significance | |
|---|---|---|---|---|---|---|---|
| 0~15 cm团聚体 0-15cm Aggregate | N组 | 组间 | 6 178.455 | 14 | 441.318 | 581 487.275 | P <0.01 |
| 组内 | 0.023 | 30 | 0.001 | ||||
| 总数 | 6 178.478 | 44 | |||||
| T组 | 组间 | 5 698.224 | 14 | 407.016 | 225 831.039 | P <0.01 | |
| 组内 | 0.054 | 30 | 0.002 | ||||
| 总数 | 5 698.279 | 44 | |||||
| J组 | 组间 | 11 886.089 | 14 | 849.006 | 1 095 873.834 | P <0.01 | |
| 组内 | 0.023 | 30 | 0.001 | ||||
| 总数 | 11 886.112 | 44 | |||||
| S组 | 组间 | 13 158.986 | 14 | 939.928 | 1 990 539.751 | P <0.01 | |
| 组内 | 0.014 | 30 | 0.000 | ||||
| 总数 | 13 159.000 | 44 | |||||
| H组 | 组间 | 7 573.124 | 14 | 540.937 | 601 090.102 | P <0.01 | |
| 组内 | 0.027 | 30 | 0.001 | ||||
| 总数 | 7 573.151 | 44 | |||||
| 15~30 cm团聚体 15-30 cm Aggregate | N组 | 组间 | 6 957.772 | 14 | 496.984 | 26 993.571 | P <0.01 |
| 组内 | 0.554 | 30 | 0.018 | ||||
| 总数 | 6 958.325 | 44 | |||||
| T组 | 组间 | 6 132.353 | 14 | 438.025 | 46 419.118 | P <0.01 | |
| 组内 | 0.283 | 30 | 0.009 | ||||
| 总数 | 6 132.636 | 44 | |||||
| J组 | 组间 | 11 099.450 | 14 | 792.818 | 89 759.660 | P <0.01 | |
| 组内 | 0.265 | 30 | 0.009 | ||||
| 总数 | 11 099.715 | 44 | |||||
| S组 | 组间 | 11 492.760 | 14 | 820.911 | 18 496.957 | P <0.01 | |
| 组内 | 1.331 | 30 | 0.044 | ||||
| 总数 | 11 494.092 | 44 | |||||
| H组 | 组间 | 6 549.796 | 14 | 467.843 | 4 589.134 | P <0.01 | |
| 组内 | 3.058 | 30 | 0.102 | ||||
| 总数 | 6 552.854 | 44 | |||||
表6 株高和茎粗试验结果方差
Tab.6
| 项目 Items | 变异来源 Source of variation | 平方和 Sum of squares | 自由度df Degree of freedom df | 均方 mean square | 比值F Ratio F | 显著性 Significance | |
|---|---|---|---|---|---|---|---|
| 株高 Height | N组 | 组间 | 7.209 | 2 | 3.604 | 885.126 | P<0.01 |
| 组内 | 0.024 | 6 | 0.004 | ||||
| 总数 | 7.233 | 8 | |||||
| T组 | 组间 | 3.216 | 2 | 1.608 | 133.747 | P<0.01 | |
| 组内 | 0.072 | 6 | 0.012 | ||||
| 总数 | 3.288 | 8 | |||||
| J组 | 组间 | 1.006 | 2 | 0.503 | 11.897 | P<0.01 | |
| 组内 | 0.254 | 6 | 0.042 | ||||
| 总数 | 1.260 | 8 | |||||
| S组 | 组间 | 3.909 | 2 | 1.955 | 91.403 | P<0.01 | |
| 组内 | 0.128 | 6 | 0.021 | ||||
| 总数 | 4.038 | 8 | |||||
| H组 | 组间 | 2.556 | 2 | 1.278 | 192.297 | P<0.01 | |
| 组内 | 0.040 | 6 | 0.007 | ||||
| 总数 | 2.596 | 8 | |||||
| 茎粗 Stem diameter | N组 | 组间 | 0.126 | 2 | 0.063 | 9.486 | P<0.01 |
| 组内 | 0.040 | 6 | 0.007 | ||||
| 总数 | 0.165 | 8 | |||||
| T组 | 组间 | 0.636 | 2 | 0.318 | 33.351 | P<0.01 | |
| 组内 | 0.057 | 6 | 0.010 | ||||
| 总数 | 0.693 | 8 | |||||
| J组 | 组间 | 1.035 | 2 | 14.056 | 58.179 | P<0.01 | |
| 组内 | 0.053 | 6 | 0.009 | ||||
| 总数 | 1.088 | 8 | |||||
| S组 | 组间 | 0.351 | 2 | 10.634 | 14.366 | P<0.01 | |
| 组内 | 0.073 | 6 | 0.012 | ||||
| 总数 | 0.424 | 8 | |||||
| H组 | 组间 | 0.077 | 2 | 0.039 | 10.854 | P<0.01 | |
| 组内 | 0.021 | 6 | 0.004 | ||||
| 总数 | 0.099 | 8 | |||||
2.2 黏质土壤改良对棉花苗期农艺性状的影响
2.2.1 不同碳源物质输入对植株株高和茎粗的影响
研究表明,不同组碳源物质输入中除了H1处理外,其它处理相较于CK处理棉花株高均表现出显著性上升的趋势。5种碳源物质对于棉花的生长有一定的帮助作用,不同组的碳源物质对棉花株高的影响呈N组>T组>S组>J组>H组>CK的规律,且各组之间均表现出差异性(P<0.01),其中农家肥的改良效果最佳,黄腐酸的改良效果相对较小。5种碳源物质随着施用量的增加株高也在增加,其中N3、T3、J3、S3和H3相较于CK处理株高分别增加了42.11%、36.23%、28.51%、28.56%和16.89%。5种碳源物质对棉花株高的改良效果与其添加比例呈正相关关系。
图3
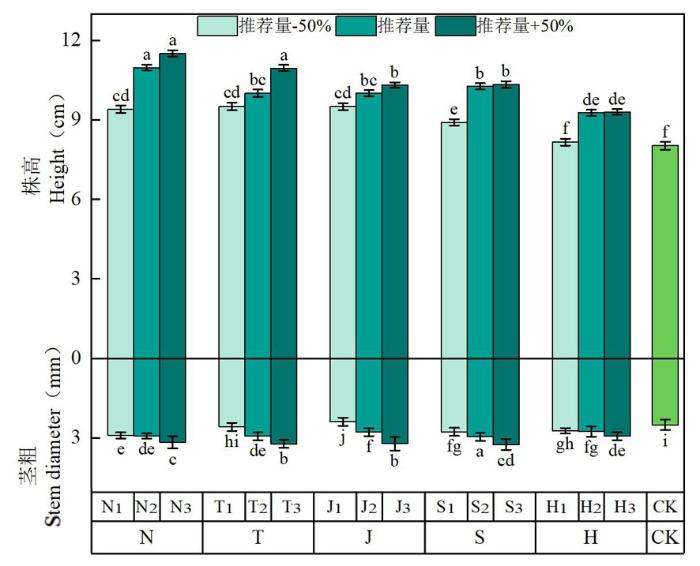
图3
不同碳源物质下株高和茎粗的变化
Fig.3
Changes of different carbon source substances on plant height and stem diameter
2.2.2 不同碳源物质输入对植株鲜重的影响
研究表明,5种碳源物质在不同梯度下对于棉花植株的地上部鲜重和地下部鲜重均有显著性提升,5种碳源物质之间也表现出差异性(P<0.01),并且植株鲜重随着施用量的增加而增加,其中N组处理对棉花地上部及地下部鲜重的改良效果最为明显,S组处理和H组处理对于地上部鲜重和地下部鲜重改良效果次之。N组中的N3处理对地上部和地下部鲜重改良效果最优,相较于CK处理分别增加了104.76%和185.71%,T3、J3、S3、H3处理相较于CK分别增加了65.48%、63.10%、73.81%和46.43%,不同组碳源物质输入对棉花地上部鲜重改良效果呈N组>S组>T组>J组>H组的规律,对棉花地下部鲜重改良效果呈N组>H组>S组>T组>J组的规律。表7,图4
表7 植株鲜重试验结果方差
Tab.7
| 项目 Items | 变异来源 Source of variation | 平方和 Sum of squares | 自由度Df Degree of freedom Df | 均方 mean square | 比值F Ratio F | 显著性 Significance | |
|---|---|---|---|---|---|---|---|
| 地上部鲜重 Fresh weight of aboveground parts | N组 | 组间 | 1.783 | 2 | 0.892 | 84.369 | P<0.01 |
| 组内 | 0.063 | 6 | 0.011 | ||||
| 总数 | 1.847 | 8 | |||||
| T组 | 组间 | 1.501 | 2 | 0.750 | 265.371 | P<0.01 | |
| 组内 | 0.017 | 6 | 0.003 | ||||
| 总数 | 1.517 | 8 | |||||
| J组 | 组间 | 1.798 | 2 | 0.899 | 366.291 | P<0.01 | |
| 组内 | 0.015 | 6 | 0.002 | ||||
| 总数 | 1.813 | 8 | |||||
| S组 | 组间 | 1.839 | 2 | 0.920 | 244.646 | P<0.01 | |
| 组内 | 0.023 | 6 | 0.004 | ||||
| 总数 | 1.862 | 8 | |||||
| H组 | 组间 | 0.048 | 2 | 0.024 | 10.904 | P<0.01 | |
| 组内 | 0.013 | 6 | 0.002 | ||||
| 总数 | 0.061 | 8 | |||||
| 地下部鲜重 Fresh weight underground | N组 | 组间 | 0.015 | 2 | 0.008 | 25.967 | P<0.01 |
| 组内 | 0.002 | 6 | 0.000 | ||||
| 总数 | 0.017 | 8 | |||||
| T组 | 组间 | 0.007 | 2 | 0.004 | 8.764 | P<0.01 | |
| 组内 | 0.003 | 6 | 0.000 | ||||
| 总数 | 0.010 | 8 | |||||
| J组 | 组间 | 0.018 | 2 | 0.009 | 60.731 | P<0.01 | |
| 组内 | 0.001 | 6 | 0.000 | ||||
| 总数 | 0.019 | 8 | |||||
| S组 | 组间 | 0.017 | 2 | 0.009 | 107.762 | P<0.01 | |
| 组内 | 0.001 | 6 | 0.000 | ||||
| 总数 | 0.018 | 8 | |||||
| H组 | 组间 | 0.008 | 2 | 0.004 | 53.950 | P<0.01 | |
| 组内 | 0.000 | 6 | 0.000 | ||||
| 总数 | 0.008 | 8 | |||||
图4
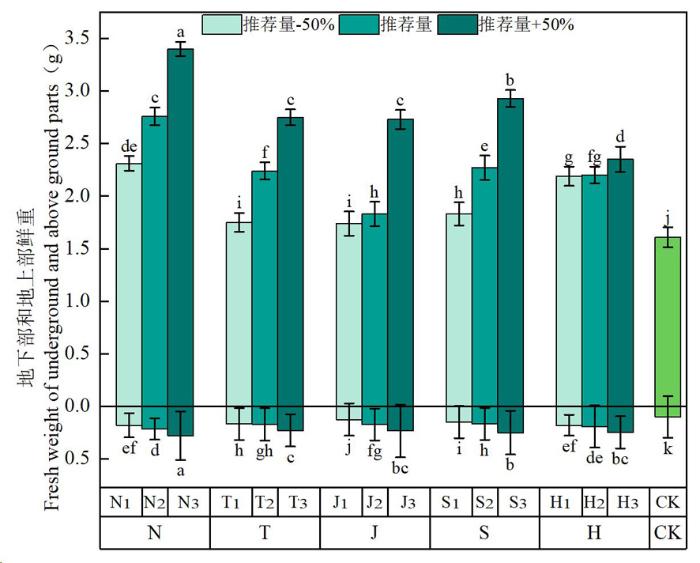
图4
不同碳源物质下植株鲜重的变化
Fig.4
Changes of different carbon source substances on plant fresh weight
2.2.3 不同碳源物质输入对植株干重的影响
研究表明,相比于CK处理,施入不同碳源物质的大多数处理植株干重均存在显著增加趋势。其中改良效果最明显的是N组,而S组中的S1、S2处理的地上部干重小于CK处理,并且S1处理与CK处理存在显著性差异。地下部干重中,除了J组中的J1处理,其他处理相比较于CK处理均存在显著性差异。并且植株干重随着施用量的增加地上部和地下部干重亦在增加,呈正相关关系。不同处理中,改良效果较优的是N3、T3、J3、S3和H3处理,相比于CK处理,地上部干重分别增加了129.21%、83.38%、80.50%、98.43%和66.10%;地下部干重分别增加了141.47%、80.44%、82.14%、94.75%和89.71%。不同组碳源物质输入对棉花地上部干重的改良效果呈N组>T组>J组>H组>S组的规律,对棉花地下部干重改良效果呈N组>H组>S组>T组>J组的规律。表8,图5
表8 植株干重试验结果方差
Tab.8
| 项目 Items | 变异来源 Source of variation | 平方和 Sum of squares | 自由度Df Degree of freedom Df | 均方 Mean square | 比值F Ratio F | 显著性 Significance | |
|---|---|---|---|---|---|---|---|
| 地上部干重 Aboveground dry weight | N组 | 组间 | 0.050 | 2 | 0.025 | 40.460 | P<0.01 |
| 组内 | 0.004 | 6 | 0.001 | ||||
| 总数 | 0.054 | 8 | |||||
| T组 | 组间 | 0.039 | 2 | 0.020 | 43.216 | P<0.01 | |
| 组内 | 0.003 | 6 | 0.000 | ||||
| 总数 | 0.042 | 8 | |||||
| J组 | 组间 | 0.045 | 2 | 0.023 | 60.988 | P<0.01 | |
| 组内 | 0.002 | 6 | 0.000 | ||||
| 总数 | 0.047 | 8 | |||||
| S组 | 组间 | 0.131 | 2 | 0.066 | 219.056 | P<0.01 | |
| 组内 | 0.002 | 6 | 0.000 | ||||
| 总数 | 0.133 | 8 | |||||
| H组 | 组间 | 0.003 | 2 | 0.001 | 22.165 | P<0.01 | |
| 组内 | 0.000 | 6 | 0.000 | ||||
| 总数 | 0.003 | 8 | |||||
| 地下部干重 Underground dry weight | N组 | 组间 | 0.001 | 2 | 0.001 | 111.258 | P<0.01 |
| 组内 | 0.000 | 6 | 0.000 | ||||
| 总数 | 0.001 | 8 | |||||
| T组 | 组间 | 0.001 | 2 | 0.000 | 64.440 | P<0.01 | |
| 组内 | 0.000 | 6 | 0.000 | ||||
| 总数 | 0.001 | 8 | |||||
| J组 | 组间 | 0.001 | 2 | 0.000 | 95.137 | P<0.01 | |
| 组内 | 0.000 | 6 | 0.000 | ||||
| 总数 | 0.001 | 8 | |||||
| S组 | 组间 | 0.000 | 2 | 0.000 | 86.916 | P<0.01 | |
| 组内 | 0.000 | 6 | 0.000 | ||||
| 总数 | 0.000 | 8 | |||||
| H组 | 组间 | 0.000 | 2 | 0.000 | 22.211 | P<0.01 | |
| 组内 | 0.000 | 6 | 0.000 | ||||
| 总数 | 0.000 | 8 | |||||
图5

图5
不同碳源物质下植株干重的变化
Fig.5
Changes of different carbon source substances on plant dry weight
2.3 各指标主成分分析和相关性
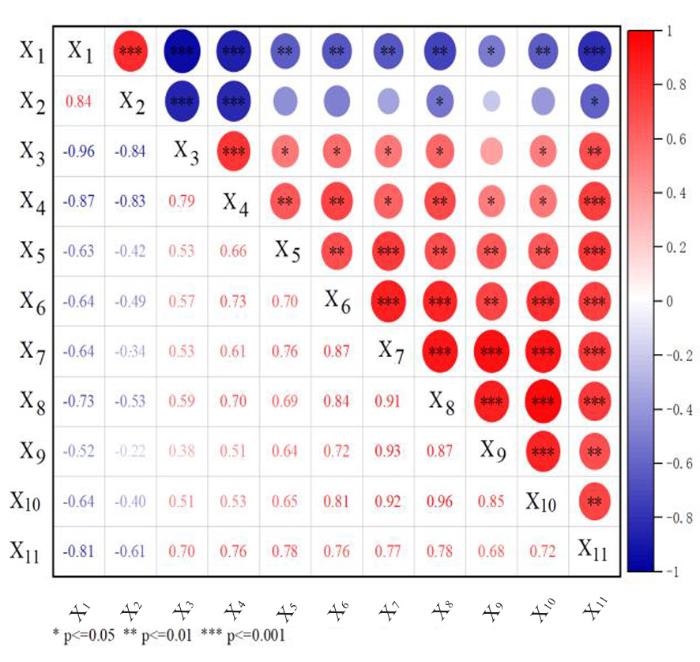
研究表明,有机质含量与0~15 cm土壤容重呈极显著负相关关系(P<0.001),与15~30 cm土壤容重呈负相关关系(P<0.05),随着有机质的增加,土壤容重在不断减小;有机质含量与X3(0~15 cm土壤孔隙度)、X9(植株地上部干重)、X10(植株地下部干重)呈显著正相关(P<0.01);与X4(15~30 cm土壤孔隙度)、X5(株高)、X6(茎粗)、X7(植株地上部鲜重)、X8(植株地下部鲜重)呈极显著正相关(P<0.001)。土壤中有机质的增加能够改善土壤结构,促进棉花生长。图6
图6
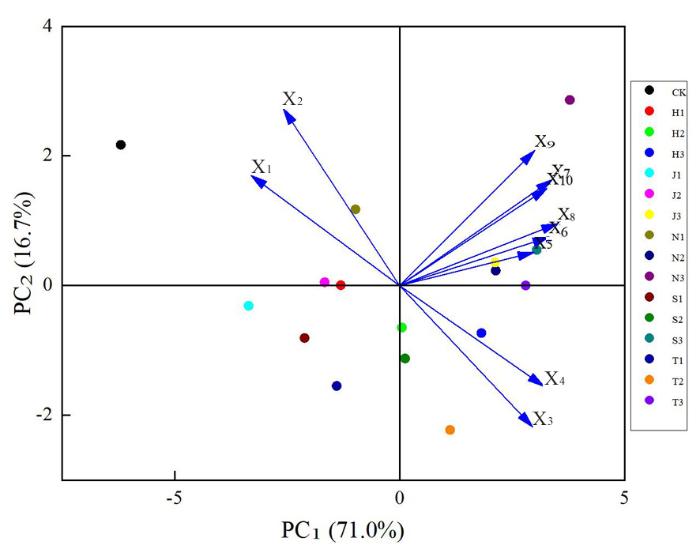
图6
主成分分析
注:X1:0~15 cm土壤容重;X2:15~30 cm土壤容重;X3:0~15 cm土壤孔隙度;X4:15~30 cm土壤孔隙度;X5:株高;X6:茎粗;X7:植株地上部鲜重;X8:植株地下部鲜重;X9:植株地上部干重;X10:植株地下部干重;X11:有机改良剂中有机质含量
Fig.6
Principal component analysis
Notes:X1:0-15 cm Soil capocity;X2:15-30 cm Soil capacity;X3:0-15 cm Soil porosity;X4:15-30 cm Soil porosity;X5:Plant height;X6:Stem thickness;X7:Fresh weight of abovegroand part of the plant;X8:Fresh weight of underground part of plant;X9:Dry weight of plant aboveground;X10:Dry weight of underground part of plant;X11:Organic mutter content in organic amendments
主成分PC1解释了总变量的71.0%,PV2解释了16.7%。即表达了87.7%解释量。碳源物质有助于缓解板结对土壤的胁迫。图7
图7
3 讨论
3.1 土壤容重是土壤重要的物理性质之一,它不仅直接影响到土壤孔隙度与孔隙大小分配、土壤的穿透阻力及土壤水肥气热变化,而且影响植物生长及根系在土壤中的穿插和活力大小[24]。作为土壤结构的基本单位,土壤团聚体的数量和质量是土壤性质和肥力的决定性因素[25]。根据多级团聚理论,直径<0.25 mm 称为微团聚体,直径>0.25 mm 称为大团聚体,微团聚体聚合形成大团聚体,相反大团聚体会破碎形成小团聚体,二者相辅相成[26]。土壤容重以及土壤孔隙度是反映土壤紧实、充气状况和土壤物理质量的重要指标[27]。研究表明,随着生物炭施入量的增加,土壤容重、比重呈明显降低趋势,0~20 cm土壤容重、比重分别降低了13.2%和1.90%,20~40 cm土壤容重、比重分别降低了10.9%和1.54%[28]。胡敏等[29]研究表明,施加生物炭有利于降低土壤容重,提高盐碱地耕层土壤的通透性,容重降低了6.11%,孔隙度提升率为13.92%。陈文涛等[30]研究表明,单施生物炭能降低土壤容重,提高土壤孔隙度。在试验中,生物炭中的T2处理(推荐量)显著降低了土壤容重,其它4种碳源物质也不同程度降低了土壤容重,T2处理以及T3处理对0~15和15~30 cm的土壤孔隙度改良效果最佳,较之CK处理,T2处理中0~15 cm容重和孔隙度分别显著降低和提高了12.78%和15.22%,15~30 cm容重降低了10.71%;T3处理中土壤孔隙度提高了19.81%。原因可能是碳源物质中的腐殖质是土壤中的主要胶结剂,能促近土壤良好结构的形成,可以增加吸热能力,提高土壤肥力,还可以适当降低土壤的紧实度以及增加土壤的孔隙度,有利于水分快速移动和土壤气体交换,从而使土壤容重降低。
3.2 机械稳定性团聚体是能够抵抗外力破坏的团聚体,是土壤自然状态下稳定的团聚体,水稳性团聚体则是可以抵抗水力分散的团聚体,可灵敏地反映土壤潜在的抗蚀能力[31]。王永平等[32]研究表明生物炭可以显著提高土壤>0.25 mm的团聚体含量。庞津雯等[33]研究发现,生物炭连续添加2年后,各覆膜处理能显著提高0~60 cm土层土壤大粒级(>0.25 mm)团聚体的机械稳定性(6.1%~8.7%)及水稳性团聚体的百分含量(15.9%~83.6%),玉米产量可显著(P<0.05)提高35.0%~41.8%。长期施用有机肥有利于土壤有机碳和活性有机碳含量的增加,促进团聚体的形成,尤其是有利于增加1~2 mm和0.5~1 mm水稳性团聚体的形成,从而改善土壤的孔隙状况[34-35]。加入不同碳源物质之后,一定程度上增加了土壤的抗侵蚀能力。其中,生物炭对土壤团聚体的改良效果较佳,其他碳源物质也有一定的改良效果,可能是施入的碳源物质中均富含有机质,且比表面积大,吸附螯合能力强,为团聚体形成提供了有利条件。在试验中也得到相似结论。
4 结论
5种碳源物质输入均能一定程度上改善土壤结构以及促进棉花生长,其中生物炭的T2处理中0~30 cm容重分别降低了12.78%和10.71%;孔隙度增加了15.22%和19.81%;0~30 cm土壤中>2 mm、1~2 mm、0.5~1 mm粒径水稳性团聚体相较于CK处理增加了455.70%,504.01%,204.94%和455.70%、516.31%和228.83%;0.25~0.5 mm、0.1~0.25 mm粒径水稳性团聚体在T3处理中相较于CK处理增加了16.32%、34.11%和37.05%、28%。农家肥中的N3处理对于棉花植株株高以及地上地下部鲜干重的改良效果最佳,相较于CK处理分别增加了42.11%和104.76%、185.71%以及129.21%和141.47%,在对与棉花植株茎粗的改良中,商品有机肥中的S3处理效果最佳相比CK处理增加了28.19%。生物炭对于改善土壤物理性质效果最佳,农家肥对于植株农艺性状改良效果最佳。
参考文献
土壤恶化的原因及治理
[J].
Reasons and treatment of soil de-terioration
[J].
土壤改良剂的研究与应用进展
[J].
Progress of research and utilization of soil amendments
[J].
土壤板结的成因与解决途径
[J].
The causes and solutions of soil compaction
[J].
重视土壤酸化消除土壤板结
[J].
Emphasizing soil acidification and eliminating soil compaction
[J].
Effect of soil compaction and N fertilization on soil pore characteristics and physical quality of sandy loam soil under red clover/grass sward
[J].
Effects of tillage options on soil physical properties and cassava-dry-matter partitioning
[J].
Influence of soil compaction on carbon and nitrogen mineralization of soil organic matter and crop residues
[J].
Response of soil CO2 and O2 concentrations to forest soil compaction at the Long-term Soil Productivity sites in central British Columbia
[J].
Soil compaction in cropping systems A review of the nature, causes and possible solutions
[J].
Soils are back on the global agenda
[J].
PAM对土壤物理性状影响的试验研究及机理分析
[J].
Effects and mechanism of PAM on soil physical characteristics
[J].
土壤改良剂节水增产效应的田间试验研究
[J].
Field experimental study of the water-saving and production-increase effects of soil conditioner
[J].
earthworm (lumbricidae) survey of North dakota fieldsplaced in the u. s. conservation reserve program
[J].
天然矿物改良剂在微咸水灌溉土壤中应用效果的研究
[J].
Study of effect on using natural minerals to improve soil in irrigating brackish water
[J].
施用畜禽粪便和化肥对土壤活性有机碳库和团聚体稳定性影响
[J].
Soil active organic carbon pool and aggregate stability as affected by application of livestock and poultry excrement and chemical fertilizer
[J].
生物炭施入对盐碱土壤影响的研究现状
[J].
盐碱土壤是中国重要的一种中低产土壤类型,由于土壤退化,盐碱地成了重要的后备耕地资源。生物炭作为农业的土壤改良剂、碳封存体和肥料的缓释载体越来越被广泛地认识和关注,在促进农业可持续发展中前景重大。通过综合分析生物炭的施加对盐碱土壤的物理化学性质、养分含量变化、微生物方面及作物生物量的研究进展,分析生物炭在盐碱地的改良效果,总结了生物炭在盐碱地改良的可能机制,以期为盐碱地的治理提供参考。
Effects of biochar application on saline-alkali soil: research status
[J].Saline-alkali soil is an important type of low and medium yielding soil in China, and due to soil degradation, saline-alkali land has become an important reserve arable land resource. Biochar has been more and more widely recognized as a soil conditioner, carbon sequester and slow-release carrier of fertilizers in agriculture, and has great application prospects in promoting the sustainable development of agriculture. By comprehensively analyzing the research progress of biochar application on physicochemical properties, content change of nutrients, soil microorganisms and crop biomass of saline-alkali soil, we studied the improvement effects of biochar on saline-alkali soil and summarized its possible mechanism of soil improving, with a view to providing support for saline-alkali land management.
Biochar applicationfor the remediation of opportunities
[J].
生物炭添加对不同水氮条件下芦苇生长和氮素吸收的影响
[J].
Effects of biochar addition on growth and nitrogen absorption of Phragmites australis under different water and nitrogen conditions
[J].
新疆盐碱地土壤改良剂的选择与应用
[J].
The selection and application of saline alkali soil amendment in Xinjiang
[J].
长期有机肥施用、秸秆还田对塿土团聚体及其有机碳含量的影响
[J].
Effects of long-term organic inputs on distribution of aggregate size and its organic carbon content on Lou soil
[J].
不同耕作和种植模式对土壤团聚体分布及稳定性的影响
[J].
Affects of distribution and stability on soil aggregate in different patterns of tillage and cropping
[J].
西北绿洲区间作模式对土壤团聚体组成及其有机碳含量的影响
[J].
Effects of intercropping regimes on soil aggregate composition and their organic carbon content in an oasis area of northwest China
[J].
不同改良剂对河套灌区盐渍化土壤性状和葵花生长特性的影响
[J].
Effects of different amendments on the properties of salinized soil and sunflower growth in Hetao irrigation district
[J].
改良剂对盐碱地燕麦生长及土壤物理性状的调控效应
[J].
Effects of amendments on oat growth and soil physical properties in saline-alkali soils
[J].
植物篱-农作坡地土壤团聚体组成和稳定性特征
[J].基于植物篱控制水土流失的长期定位试验,研究植物篱-农作坡地土壤团聚体组成和稳定性特征.结果表明: 与常规等高农作模式相比,植物篱-农作复合农业模式下土壤>0.25 mm机械稳定性和水稳性团聚体含量分别显著增加13.3%~16.1%和37.8%~55.6%,明显提高了各坡位粒级>0.25 mm土壤水稳性团聚体含量,改善了粒级>0.25 mm土壤水稳性团聚体在下坡位的相对富集和上坡位相对贫乏的状况.植物篱显著提高了土壤团聚体平均质量直径和几何平均直径,降低了土壤团聚体分形维数和>0.25 mm土壤团聚体破坏率,进而增强了土壤团聚体的稳定性和抗蚀性.坡度与植物篱类型对土壤团聚体组成、稳定性和坡面变化无显著影响.
Composition and stability of soil aggregates in hedgerow-crop slope land
[J].Based on a long-term experiment of using hedgerow to control soil and water loss, this paper studied the composition and stability of soil aggregates in a hedgerow-crop slope land. Compared with those under routine contour cropping, the contents of > 0.25 mm soil mechanical-stable and water-stable aggregates under the complex mode hedgerow-crop increased significantly by 13.3%-16.1% and 37.8% -55.6%, respectively. Under the complex mode, the contents of > 0.25 mm soil water-stable aggregates on each slope position increased obviously, and the status of > 0.25 mm soil water-stable aggregates being relatively rich at low slope and poor at top slope was improved. Planting hedgerow could significantly increase the mean mass diameter and geometric mean diameter of soil aggregates, decrease the fractal dimension of soil aggregates and the destruction rate of > 0.25 mm soil aggregates, and thus, increase the stability and erosion-resistance of soil aggregates in slope cropland. No significant effects of slope and hedgerow types were observed on the composition, stability and distribution of soil aggregates.
生物炭和氮肥配施对椒园土壤团聚体结构及作物产量的影响
[J/OL].
Effects of combined application of biochar and nitrogen fertilizer on soil aggregate structure and crop yield in pepper orchards
[J].
生物炭不同添加量对旱作覆膜农田土壤团聚体特性及有机碳含量的影响
[J].【目的】研究西北旱作区长期地膜覆盖农田添加不同量生物炭对土壤团聚体稳定性和有机碳含量的影响,为旱作覆膜农田地力提升、作物的可持续生产提供科学依据。【方法】在连续多年双垄沟覆膜农田基础上,采用裂区设计,主区为全膜双垄沟覆盖种植和传统平作不覆膜种植2个处理,副区为生物炭添加水平,分别为不添加(N)、低量添加(L):3 t·hm<sup>-2</sup>、中量添加(M):6 t·hm<sup>-2</sup>和高量添加(H):9 t·hm<sup>-2</sup>。测定生物炭不同添加量对覆膜农田不同粒级土壤团聚体含量、团聚体稳定性、团聚体有机碳含量及玉米产量的影响。【结果】生物炭连续添加两年后,各覆膜处理能显著提高0—60 cm土层土壤大粒级(>0.25 mm)团聚体的机械稳定性(6.1%—8.7%)及水稳性团聚体的百分含量(15.9%—83.6%),玉米产量可显著(P<0.05)提高35.0%—41.8%。在覆膜条件下,添加生物炭能显著提高土壤大粒级团聚体百分含量及其稳定性,干筛>0.25 mm 粒级团聚体含量(MR<sub>0.25</sub>)和湿筛>0.25 mm 粒级团聚体含量(WR<sub>0.25</sub>)分别平均提高6.8%和29.6%,且随生物炭添加量的增加增幅逐渐增大。此外,生物炭添加提高了覆膜农田土壤有机碳及团聚体有机碳含量,其中以高量添加(9 t·hm<sup>-2</sup>)效果最好,分别提高13.9%和25.9%。玉米产量与生物炭添加量显著相关(λ=0.42,P<0.001),且在覆膜条件下产量最大(12.8 t·hm<sup>-2</sup>)。【结论】生物炭添加可提高覆膜农田土壤团聚体含量及稳定性,增加玉米产量,还可以显著增加土壤有机碳含量,促进有机碳固存,且添加量为9 t·hm<sup>-2</sup>时效果较好。
Effects of different biochar application rates on soil aggregate characteristics and organic carbon contents for film-mulching field in semiarid areas
[J].【Objective】The aim of this study was to investigate the effects of long-term plastic film mulching farmland combined with different biochar input rates on soil aggregate stability and organic carbon in northwest China, in order to provide a scientific basis for improving the soil fertility and maintaining the sustainability of crop production for film-mulching field in semiarid regions. 【Method】Based on continuous years of double ridge furrow film mulching (D), the full film double ridge furrow mulching planting and traditional flat without film mulching planting were set as the main treatment, and four biochar input rates (no returning (N), 3 t·hm-2 (L), 6 t·hm-2 (M), and 9 t·hm-2 (H) ) were set as the secondary treatment respectively to investigate the effects of different biochar input rates on soil aggregate distribution, aggregate stability, aggregate organic carbon and maize yield.【Result】The film mulching could significantly (P<0.05) increase the soil mechanical stable (6.1%-8.7%) and water-stable macro-aggregate contents (15.9%-83.6%) and maize yield (35.0%-41.8%). Under the film mulching planting, biochar inputs treatments could significantly (P<0.05) increase mechanical macro-aggregate and water macro-aggregate by 6.8% and 29.6% on average, respectively, and the effects gradually increased with the increase of biochar inputs rate. In addition, biochar inputs could also increase the soil organic carbon and aggregate organic carbon content in film mulching farmland, and the effects under DH (9 t·hm-2) were better than other treatments, with an average increased by 13.9% and 25.9%, respectively. Maize yield was significantly correlated with biochar addition rates ( λ=0.42, P<0.001 ), and DH had the highest yield with 12.8 t·hm-2. 【Conclusion】Biochar input could significantly improve soil aggregrate characteristics and organic carbon content in plastic film mulching farmland, thus increase the maize yield and promote soil carbon sequestration, especially with 9 t·hm-2.
不同施肥处理对红壤水稻土团聚体有机碳分布的影响
[J].
Effects of fertilization on soil organic carbon distribution in various aggregates of red paddy soil
[J].
长期施肥对黄土丘陵区土壤理化性质的影响
[J].
Effects of long-term fertilizatton on soil physical and chemical property in loess hilly area
[J].
有机肥对棉花出苗、生长发育及产量的影响
[J].
The effect of organic fertilizer on cotton emergence, growth and development, and yield
[J].
有机物料与化肥配施提升土壤肥力、养分利用和玉米产量研究
[J].
Experimental study on combined application of organic materials and chemical fertilizers to improve soil fertility, nutrient utilization and maize yield
[J].
